Working With Studies
Barchart Trader allows you to add an unlimited number of studies on a chart. Studies are classified as either Overlay studies (plotted in the same pane as the symbol data) or Stand-alone studies (a study that uses a different price scale than that of the underlying symbol).
When you add a study to a chart, It is added using default parameter and color settings. You may change these settings by editing the study.
Add a Study
- Click the + Study button at the top of the chart, and select the study from the list.
OR
Right-click on the chart, and select Add Study.
Result: The Add Study dialog box appears. - You may either use the scroll bar to find the desired study, or type the study name in the Search box at the top of the dialog box to narrow down the selections shown.
- Click on the desired study.
Result: The study is added to the chart.
Edit a Study: Change Parameters or Colors
Once the study is added to the chart, you can edit it to modify its parameters or the color(s) used to draw the study.
- Click the down arrow, just to the right of the study as it appears in the chart header:
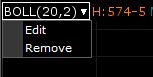
- Click Edit.
Result: The Edit Parameters dialog box displays. - Depending on the study, you may see one or more parameter settings, and color / plot options for each line drawn. Make any desired adjustments.
- Click OK to update the study.
Delete a Study
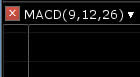
- Click the down arrow, just to the right of the study as it appears in the chart header.
Note: For stand-alone studies (those that appear under the main chart pane), you may also click the X to the left of the study label.
- Select Remove.
Resizing Panes
When a Stand-alone study is added, it appears as a separate pane underneath the symbol's data. Chart panes are divided by a separator (or padded bar), which can be dragged and dropped to change the size of each pane.
The color of the Pane Separator is defined in the Chart Properties.