Leaderboard Panel

The Leaderboard panel allows you to view different lists of Stocks, ETFs, Mutual Funds and Forex symbols. Each leaderboard is configurable with multiple views, and can be customized to filter by asset type, exchange and number of results to display.

Add a Leaderboard

  1. Click the + button, found on the bottom right of the application. From the Equities grouping in the panel chooser, click Leaderboards.
  2. A preview window appears. If desired, change the view or symbol.
  3. Click Add to Workspace.

Leaderboard Parameters

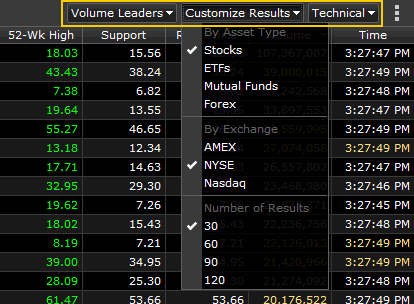
The top right corner of the Leaderboard contains three drop-down lists with options for defining the data to display in the panel.

Parameters

Option Description
Leaderboard Type

Choose from:

  • Volume Leaders: Sorted by descending daily volume
  • Percent Advances: Sorted by descending percent change
  • Percent Declines: Sorted by ascending percent change
  • Top Performers: Sorted by descending Standard Deviation
  • Bottom Performers: Sorted by ascending Standard Deviation
  • 52 Week Highs: Symbols making new 52 Week Highs
  • 52 Week Lows: Symbols making new 52 Week Lows
Customize Results

Allows you to fine-tune the information displayed.

  • By Asset Type: Choose to display Stocks, ETFs, Mutual Funds, or Forex
  • By Exchange: Choose from AMEX, NYSE, or NASDAQ
  • Number of Results: Display 30, 60, 90 or 120 results.
Views

Choose a pre-defined view, or customize the columns.

  • Default: Symbol, Name, Exchange, Last, Change, %Change, Bid, Ask, Open, High, Low, Volume, Time
  • Performance: Symbol, Name, Last, Change, %Change, Volume, Time, Standard Deviation, 20-Day Percent, 50-Day Percnet, 100-Day Percnet, YTD Percent
  • Technical: Symbol, Name, Last, Change, %Change, Volume, Time, 20-Day Relative Strength, 20-Day Historic Volatility, 52 Week Low, 52-Week High, Support, Resistance
  • Custom: Choose your own fields to display.