Seasonality Charts
A seasonality chart allows you to compare multiple futures contracts, whether active or expired, on the same time series. This allows you to analyze seasonal patterns across the same calendar period. In the example below, the active contract form March 2014 Corn is compared against the three previously expired contracts. Contract expiration dates appear at the top of the chart.
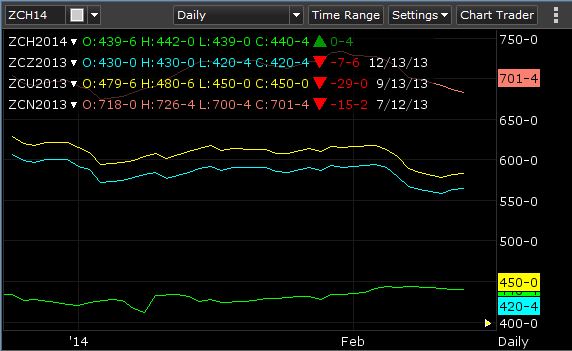
A Seasonality chart can compare up to five symbols.
Create a Seasonality Chart
- Click the Settings button on the top right of the chart, and select Comparisons.
OR
Right-click on the chart and select Comparisons.
Result: The Symbol Comparisons dialog box appears. - Enter up to four symbols for comparison, choosing a color for the symbol from the lost shown.
- Check the Align on expirations box.
- Click OK when done.
Related Topic: Comparison Charts